The Insights Console is a debugging tool that logs the automated behaviour of a site, including the execution of expressions and the assignment of values to variables. This enables you to use an insight to identify what happens behind the scenes while using an application, including identifying which parts are causing errors or affecting performance.
To access the console, create or join an active insight, click the ![]() icon in the bottom-left corner, and then select Console. This opens the console in a new browser tab.
icon in the bottom-left corner, and then select Console. This opens the console in a new browser tab.
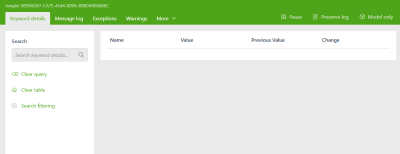
The console consists of several tabs, each of which record different data gathered while using the insight. Any changes that occur while you're using the insight in the same browser window will be reflected within the console in real-time.
Some of the tabs are accessed by clicking the More menu.
In the top-right corner, alongside the tabs, you will find options for running the console:
| Option | Description |
|---|---|
| Pause | Pauses the insight, during which no new items will be created. |
| Preserve Log | Determines if the log should be reset when a postback occurs or a new page loads. If this is selected, old items will be preserved. |
| Model Only | Determines if the log should only include items relevant to the model. If this is selected, no items to do with non-model functionality, such as CDS content, will be included. |
In addition, the menu on the left contains a search box and a number of options relevant to the current tab:
| Option | Description |
|---|---|
| Clear Query | Clears the search field. |
| Clear Table | Clears the current tab, removing all items from the list. |
| Search Filtering | This toggle can be ticked if you want to hide all items in the current view that do not match the search term. If this is not ticked, the search will instead just highlight matching terms. |
Finally, several tabs also enables you to copy specific items in the list to your clipboard by clicking the icon next to the item.
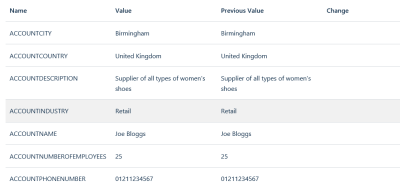
The Keyword Details tab shows a list of all currently active keywords.
In addition to each keyword's Name and current Value, the list also shows whether or not the value of each keyword was updated during the last postback. If a value has been updated you can see the old one in the Previous Value column.
If a new keyword is added or an existing one is assigned a new value, this will be noted in the Change column.
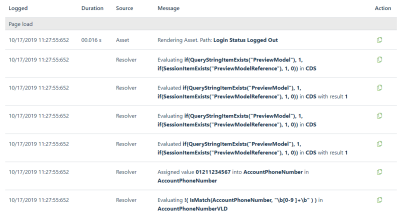
The Message Log tab shows a complete log of all events that occur while the application is running, including expression executions, data source calls, and more.
For example, if you activate a button that triggers a series of expressions, the log will show the details of each expression in the order it was executed, including its result. By analysing this data and comparing it to what the expected results, you can see the point at which the application behaves incorrectly, then make changes to fix the issue.
The Exceptions tab shows a list of errors and exceptions that have occurred during the current insight.
The Warnings tab shows a list of less severe errors and other warnings.
The Resolver tab enables you to test expressions against the current insight, enabling you to view the result and see how it affects the site.

The Resolver tab.
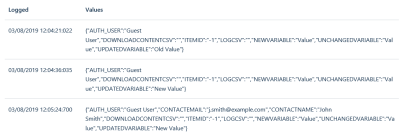
The Keyword Log tab is devoted to displaying keyword values, but each item is formatted as a CSV list.
These lists serve as a snapshot of all keywords and their respective values at a specific point. Every time a postback occurs, a new item is added.
The Data Sources tab displays a list of all data sources that are currently active.
The Page Request Log tab shows a list of all individual pages that have been requested during the current session.
Alongside the timestamp for when the request was logged, its source and ID, you can see the full URL of each page. This enables you to see exactly which pages are called during a session, both external and internal.
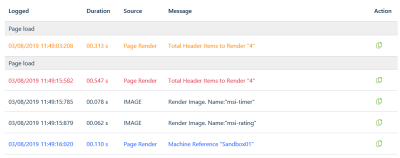
The Timings tab contains the amount of time it takes for the site to complete different tasks.
The items in this list are colour-coded based on the amount of time each one takes to complete:
- Black - Under 100 milliseconds.
- Blue - 100-300 milliseconds.
- Orange - 300-500 milliseconds.
- Red - Over 500 milliseconds.
While you can see the actual amount of time listed in the Taken column, the colours enable you to get a quick overview to easily spot areas that may be affecting your site's performance.
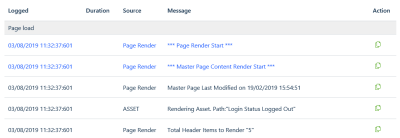
The Page Render tab shows a list of every item that loads when accessing each page, sorted chronologically with the most recent items towards the top.
By looking at this, you can see in what order each part of the page renders. This includes master page content, stylesheets, scripts, page content, and more.
The CDS Render tab contains all content related to CDS, such as master pages and assets.
The Security tab shows a list of potentially dangerous events that have occurred, such as security concerns and expressions that cannot be executed.

