
You can customise the look of a chart area in several ways, including adding a border, giving it a background colour, and even apply a 3D effect.
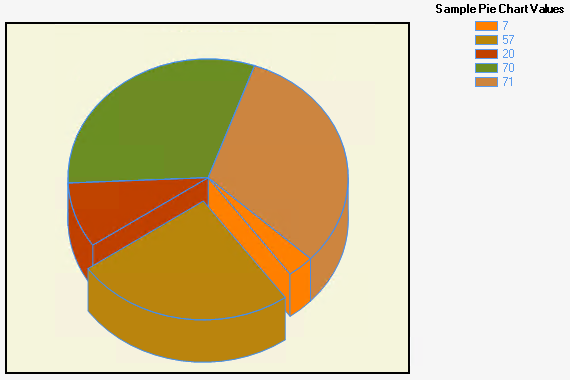
Example of a chart with a border, background colour, legend, and 3D effect.
To customise the chart's styling, open the Appearance panel in the Chart Area interface:
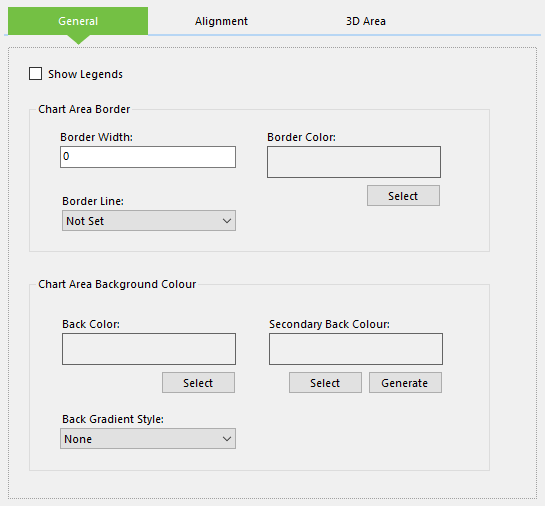
Configuring the appearance of a chart area.
This consists of three tabs, the first of which is called General. In addition to the Show Legends option, this tab is split into two sections. First is Chart Area Border, which contains the following options:
- Border Width - The width of the border in pixels. Setting this to 0 will remove the border.
- Border Color - The colour to apply to the border.
- Border Line - The style to apply to the border. Setting this to Not Set will remove the border.
Following this is the Chart Area Background Colour section, which enables you to do the following:
-
Back Colour - The main colour to use for the chart's background.
- Secondary Back Colour - The second colour to use for the chart's background. This is only required if using a gradient style, and you can click Generate to automatically pick a colour that matches the currently selected main background colour.
- Back Gradient Style - The gradient style to apply to the chart background.
The Alignment tab contains options that enable you to align the current chart area against another in the same definition. It contains the following settings:
- Align With Chart Area - The chart area against which you want to align the current one.
- Alignment Orientation - Determines how the two charts will be aligned against each other.
- Alignment Options - Further options for how the charts are aligned within the definition.
Finally, the 3D Area tab enables you to apply various 3D effects to the chart. Start off by ticking the Enable 3D check box, which will activate the rest of the options.
Some of the following chart examples have been oriented using the Inclination and Rotation options or given a Point Depth in order to assist in the demonstration of other settings. Unless otherwise states, the same values have been used for each option in each chart.
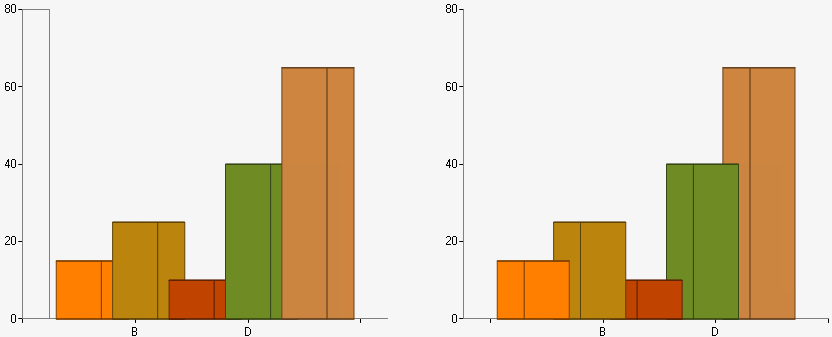
The Wall Width option determines the distance of the chart edges from the 'surface' of the page in pixels. This option does not affect the depth of the chart itself, as shown in this example:
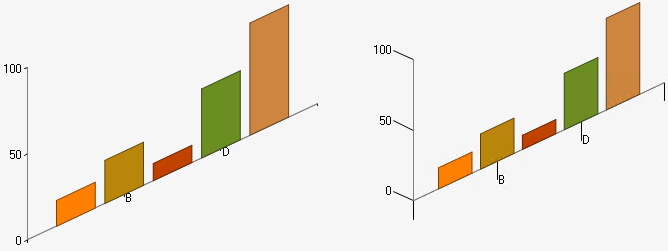
Charts with no wall width (left) and wall width set to 30 (right).
The Perspective option determines the distance and perspective of the chart from the screen. This option will also shift the chart axes from the normal orientation and potentially distort the chart.
Charts with default perspective (left) and perspective set to 50 (right).
You can tick Is Right Angle Axes to force the axes to remain oriented at right angles to the viewer and maintain the specified distance..
The Point Depth option determines chart's the Z-axis depth in pixels.
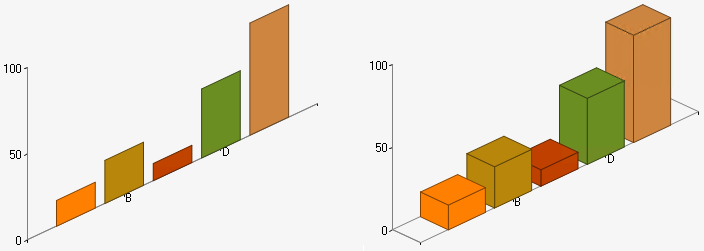
Charts with no point depth (left) and point depth set to 75 (right).
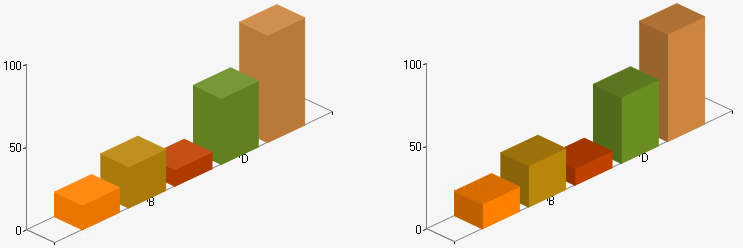
The Point Gap Depth option determines the Z-axis distance between each series in the area in pixels. This option also requires that the Point Depth is set to greater than 0.
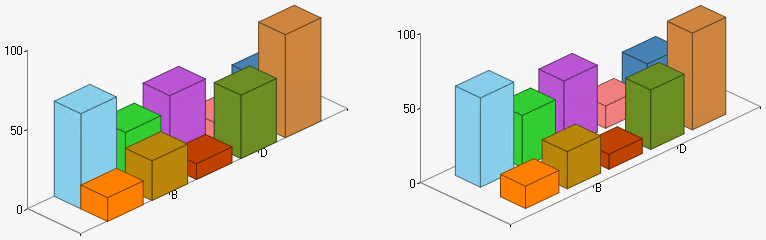
Charts with no point gap depth (left) and the point gap depth set to 100 (right).
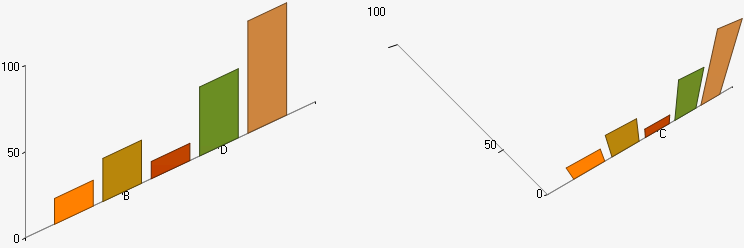
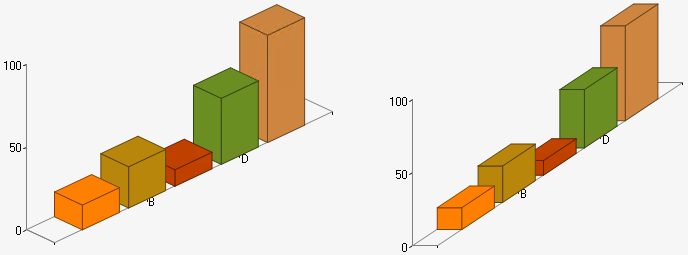
The Inclination option rotates the chart on the X-axis, from -90 to +90 degrees. Positive values will rotate the chart 'down', showing the top of the chart, while negative values will rotate the chart 'up', showing the chart's base. This option also requires that the Point Depth is set to greater than 0.
Charts with the inclination set to 55 degrees (left) and -55 degrees (right).
The Rotation option rotates the chart on the Y-axis, from -180 to +180 degrees. Positive values will bring the right edge closer to the viewer, while negative values will bring the left edge towards the viewer. This option also requires that the Point Depth is set to greater than 0.
Charts with the inclination set to 55 degrees (left) and -55 degrees (right).
The Light Type drop-down menu can be used to select a lighting effect. This option also requires that the Point Depth is set to greater than 0.
Charts with the light type set to Realistic (left) and Simplistic (right).
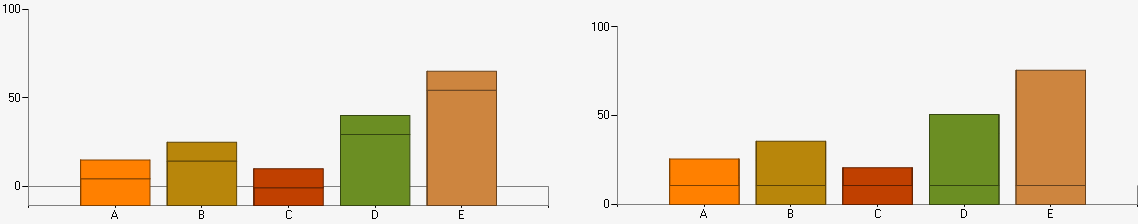
The Is Right Angle Axes option will force the chart to be oriented its axes at right angles to the viewer, overriding any other settings that affect its orientation, but will maintain any other settings accordingly. This can be ticked if values have been specified for either of the Perspective, Inclination, or Rotation options.
Charts with Is Right Angle Axes disabled (left) and enabled (right).