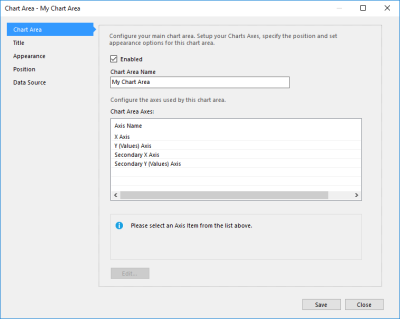
A Chart Area is a container that holds a single chart within a traditional chart. It also defines the appearance, position, and type of data used. Every chart definition must contain at least one chart area by default, but more can be added as required. Each area in a definition is configured completely independently of each other, using different sets of data and settings.
Each chart will always take up an equal amount of space within the chart definition.
Chart areas are created and managed through an interface that's accessible when configuring a chart definition.
To learn how to configure and modify a chart area, refer to the following topics:
| Description | Further Reading |
|---|---|
| Add a new chart area to a chart definition. | Creating a Chart Area |
| Edit an existing chart area. | Editing a Chart Area |
| Create a copy of an existing chart area. | Copying a Chart Area |
| Permanently delete a chart area. | Deleting a Chart Area |

