
When configuring a chart area axis there are a number of general settings you can use to manage the axis' behaviour. You can find these in the General panel within the Chart Area Axis interface:
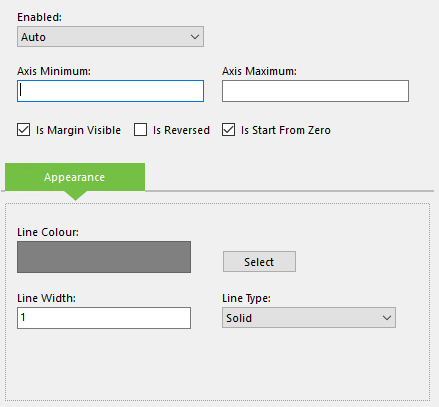
Configuring general settings for a chart area axis.
Here you will find the following options:
- Enabled - This determines if the axis should be enabled or disabled in the chart area. If this is left as Auto, the axis will only appear if it is provided with data.
- Axis Minimum - The lower limit of the data plotted on the axis. This will omit data that falls below the specified number.
- Axis Maximum - The upper limit of the data plotted on the axis. This will omit data that falls above the specified number.
- Is Margin Visible - Toggles the visibility of empty space on the chart's edge. If disabled, the data will be displayed directly along the axis.
- Is Reversed - If selected, this flips the orientation of the axis, meaning that the data will be plotted from the opposite end of the axis.
- Is Start From Zero - If selected, the chart will omit negative values from the axis.
- Line Colour - The colour to apply to the axis.
- Line Width - The width of the axis in pixels. Setting this to 0 will remove the border.
- Line Type - The style to apply to the axis. Setting this to Not Set will remove the border.