
A chart area can display up to four axes depending on the type of chart used and how its source data is structured. A typical chart area will render the X and Y axes—the bottom and left edges, respectively—by default. The secondary X and Y axes—the top and right edges—will only render if the series assigned to the chart area is configured to plot data along those axes.
You can customise many aspects of an axis, including its visual settings and its interactivity options. This is done from the interface where you create and manage chart area by selecting one of the axes and clicking Edit.
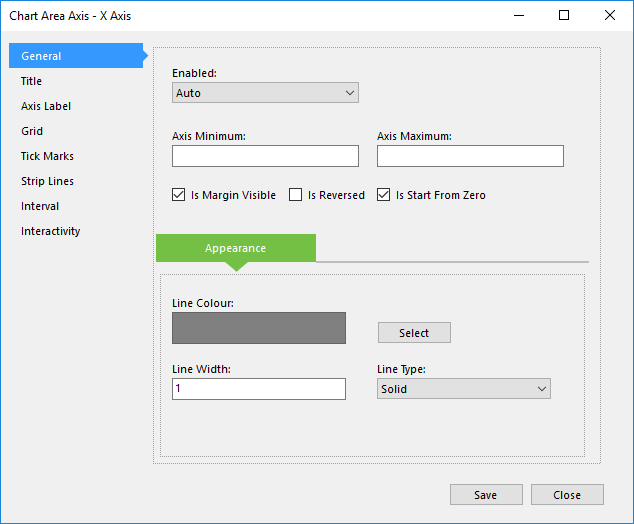
Configuring a chart area axis.
The options in this interface are identical for all axes.