
When configuring a chart area axis you can apply grid lines along the axis. Y-axis grid lines are rendered horizontally, and X-axis grid lines are rendered vertically.
You have the option to apply Major and Minor grid lines. Major lines are plotted along axis intervals, while minor ones are plotted every 20% between major grid lines. For example, the following chart contains major (solid) and minor (dashed) grid lines on both axes:
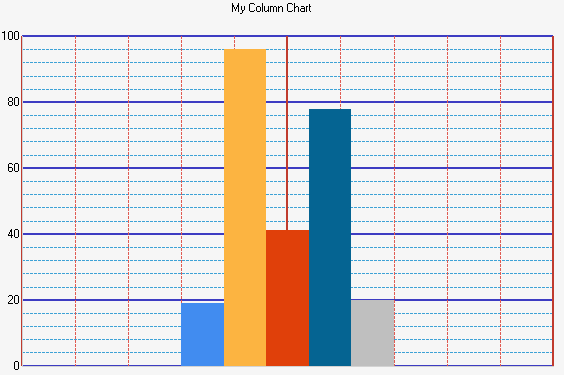
Column chart with X- and Y-axis grid lines.
To customise axis grid lines, open the Grid panel in the Chart Area Axis interface:
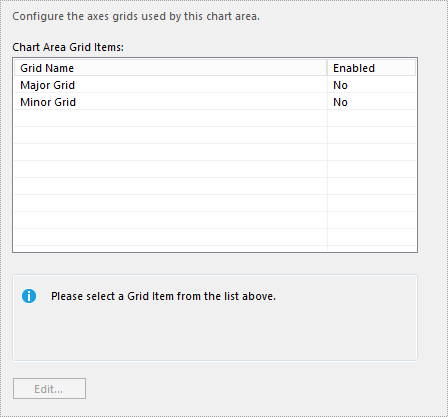
Configuring chart area axis grid lines.
Select a grid line and click Edit to bring up its settings. Here, you will see the following options:
- Enabled - Tick to enable the grid line.
- Axis Grid Colour - The colour to apply to the grid line.
- Grid Line Width - The grid line's width in pixels.
- Line Type - The style to apply to the line.