
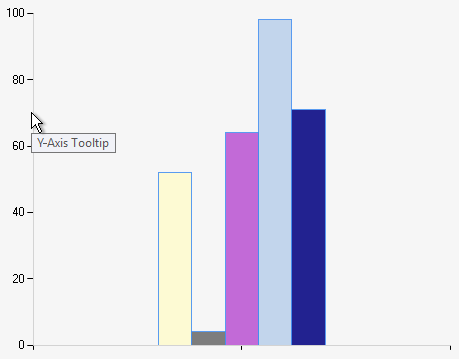
When configuring a chart area axis you can add interactive elements to it, such as a tooltip that appears when hovering over the axis or turn it into a clickable hyperlink. The following example shows a chart where the Y-axis has been assigned a tooltip:
Column chart with X- and Y-axis grid lines.
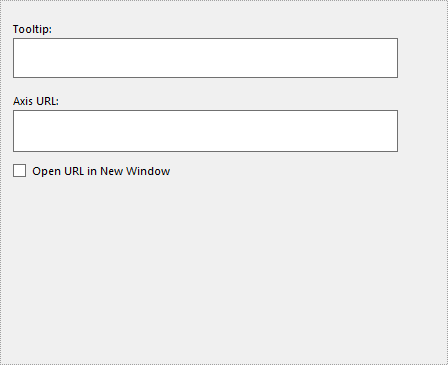
To manage the interactive elements of an axis, open the Interactivity panel in the Chart Area Axis interface.
Column chart with X- and Y-axis grid lines.
This panel contains the following options:
- Tooltip - Enter the text to use as a tooltip.
- Axis URL - Enter the URL to use as the hyperlink. If the link should open in another browser window, tick the Open URL in New Window check box.