
When configuring a chart area axis you can choose the frequency of the interval markers that appear on each axis. The following chart shows an example of this, where interval markers have been applied to both axes. The Y-axis uses an interval set to 20, while the X-axis uses one set to 2:
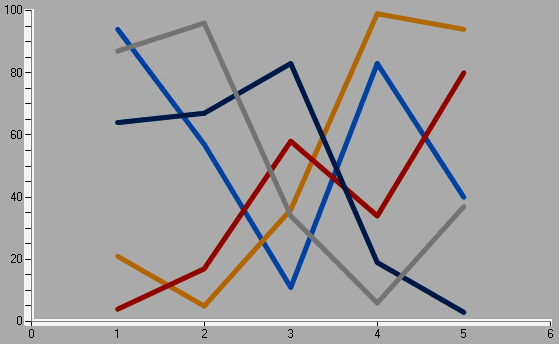
Chart with customised interval settings.
To add and customise the axis interval, open the Interval panel in the Chart Area Axis interface:
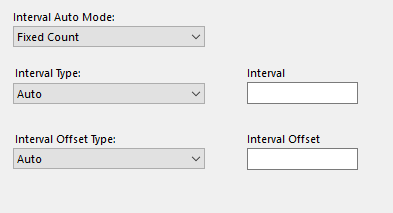
Chart with customised interval settings.
Here you can configure the following options:
- Interval Auto Mode - Can be used to automatically generate intervals. Selecting Fixed Count will by default produce five equally spaced intervals, regardless of the scope of the data. Selecting Variable Count will generate intervals according to the distribution of the data, producing many small or few large intervals accordingly.
- Interval - Can be used to define specific axis intervals. The resulting axis will display interval markers spaced according to the value entered here.
- Interval Type - The type of data the axis is plotting.
- Interval Offset - Specifies the first interval marker after 0. Subsequent intervals will follow normal spacing rules. Specifying a value in this field will not prevent the axis from rendering values lower than the one specified.
- Interval Offset Type - The type of data the axis is plotting.