
When configuring a chart area axis you can apply a label that can provide additional information. For example, the following line chart contains modified labels on both the X- and Y-axes. The Y-axis label uses an offset of 10 and an interval or 5, while the X-axis label has been rotated and underlined:
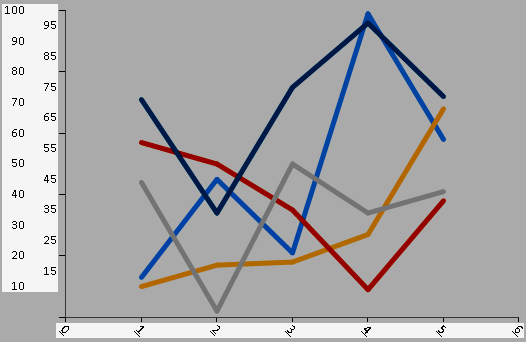
Line chart with customised X and Y axis labels.
To add and customise labels, open the Axis Label panel in the Chart Area Axis interface:
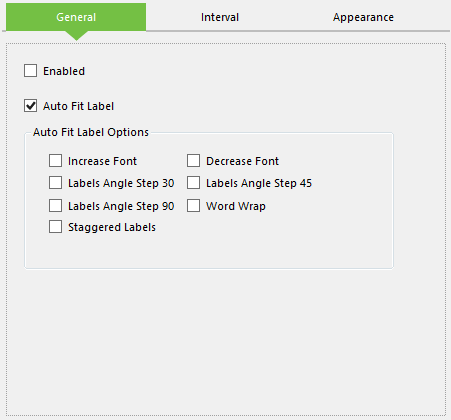
Configuring chart area axis labels.
This panel consists of three tabs, the first of which is called General and contains the following options:
- Enabled - Tick this to add a label to the chart axis.
- Auto Fit Label - Tick this to enable several additional options for the label, such as increasing or decreasing the font size and applying an angle to the text. These appear as a series of check boxes in the Auto Fit Label Options section below this option.
Next is the Interval tab, which contains the following options for defining the range between values on the axis:
- Interval - The distance between each interval marker on the axis.
- Interval Type - The type of interval marker to use.
- Interval Offset - Determines the first value after 0 on the axis.
- Interval Offset Type - The type of interval offset to use.
Finally, the Appearance tab contains the following options:
- Font Name - The name of the font to use for the label text.
- Font Size - The size of the text in pixels.
- Bold/Italic/Underline - Style to apply to the text.
- Angle - Defines the orientation angle of the label, which can be between -90 degrees and 90 degrees.
- Format - A standard numeric format to apply to the label. A complete list of standard numeric formatting options can be found in this MSDN article.
- Label Fore Colour - The colour of the label text.
- Is End Label Visible - Toggles the visibility of the first and last label values on the axis.
- Is Staggered - Determines if the axis label should display every other value outside of the normal alignment, which can be useful if the axis represents a lot of values.
- Truncated Labels - Determines if long labels should be shortened.