
You can control the appearance of interval markers along a chart area axis. Tick marks can be Major, which are plotted with every axis interval, and Minor, which are plotted every 20% between major tick marks. The following example shows a chart with styled major (long) and minor (short) tick marks on both axes:
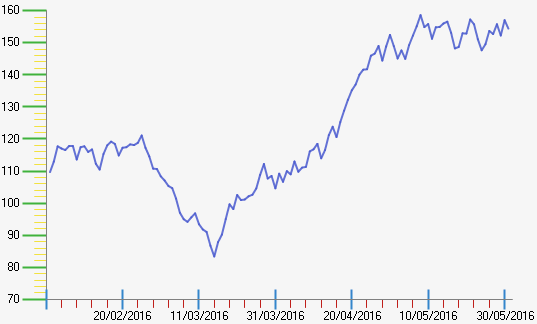
Column chart with X- and Y-axis grid lines.
To customise the tick marks on an axis, open the Tick Marks panel in the Chart Area Axis interface:
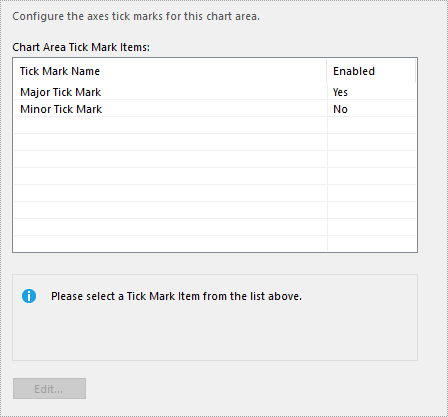
Configuring chart area axis grid lines.
Select a tick mark and click Edit to bring up its settings. Here, you will see the following options:
- Enabled - Tick to enable tick marks on the axis.
- Axis Tick Mark Colour - The colour to apply to the tick marks.
- Width - The tick mark's width as a percentage value.
- Length - The tick mark's length as a percentage value.
- Tick Mark Type - Controls where the tick mark is position, such as above or below the axis line. If set to None, the tick mark will not appear.
- Line Type - The style to apply to the tick mark.