
If a chart area requires a data source, you can specify which fields to include and exclude from the chart. To customise the title, open the Data Source panel in the Chart Area interface:
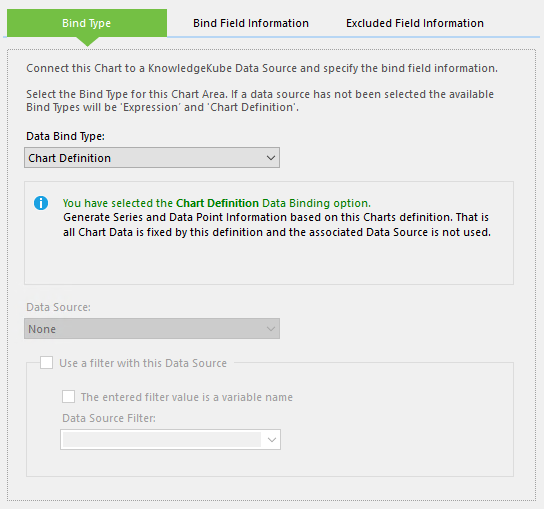
Configuring the data source for a chart area.
The Bind Type panel enables you to select the bind type to use, and set the Data Source and Data Source Filter to use. The remaining two tabs can be used to define which fields from the selected data source to display in the chart.
First is the Bind Field Information tab, where you can choose which fields to include and how they should be used in the chart. The majority of options here are specific to particular bind types.
- Select the X Axis Column Name - The field in the data source to use for the chart's X-axis.
- Select the Y Axis Column Name(s) - One or more data source fields to use for the chart's Y-axis. You can specify multiple fields by writing each name separated by a comma.
- Select the Group By Column Name - This is used by the Cross-Table data bind type to generate series based on the values in the field specified here. Series are generated based on the number of distinct values in the Group By field, with the Y-axis data clustered according to each unique X-axis field in the data set.
- Select the Series Name - This is used by the Series By Row data bind type in place of X-axis values when determining elements such as the chart legend.
- Other Field - Designates the value of a field as a label or tooltip. Enter the word "Label" or "Tooltip", followed by an equal symbol (=) and then the name of the field whose value you want to reference. You can apply both a label and a tooltip by separating the instructions with a comma. You can also apply standard formatting to numeric values.
You can also apply standard formatting to numeric values in a label or tooltip. A complete list of standard numeric formatting options can be found in this MSDN article.
Finally, the Excluded Field Information tab enables you to exclude specific data source fields from the chart. You should use the options in this tab in the following situations:
- Your source data includes fields that cannot be rendered, such as a GUID. Including incompatible field types will cause the chart to error.
- You cannot filter or otherwise control the data source fields.
- You are using a large data set and wish to make your data bind perform more efficiently.
Select one or more fields you want to exclude from the drop-down menu and click Add, or simply enter their names into the text field, each separated with a comma.