
You can customise the look of a chart legend in several ways, including adding a changing the font, text size, and colour. The following examples shows a legend that has customised text settings, a border, interlaced rows, and a gradient background.
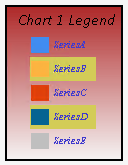
Chart legend with customised styling.
To customise the legend's styling, open the Appearance tab within the Legend Definition panel when configuring the legend:
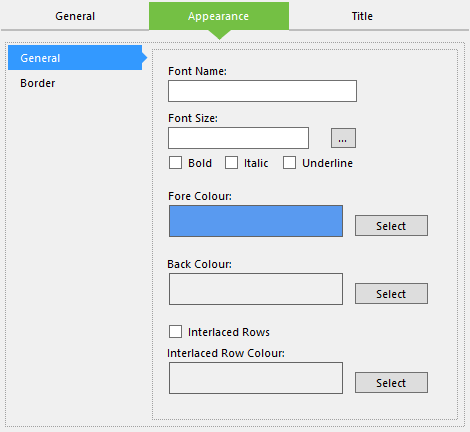
Configuring a chart legend's appearance.
This tab contains two panels, the first of which is General. Here, you will find the following options:
- Font Name - The name of the font to use for the legend's text.
- Font Size - The size of the text in pixels.
- Bold/Italic/Underline - Style to apply to the text.
- Fore Colour - The colour of the text.
- Back Colour - The colour to use as the legend's background.
- Interlaced Rows - Tick this to apply highlighting to every other row in the legend.
- Interlaced Row Colour - The background colour to set as the secondary colour if interlaced rows are used.
Next is the Border panel, where you can add a border to the legend using the following options:
- Border Color - The colour to apply to the border.
- Back Gradient Style - The gradient style to apply to the legend background.
- Border Dash - The style to apply to the border. Setting this to Not Set will remove the border.
- Border Width - The width of the border in pixels. Setting this to 0 will remove the border.