
A Legend provides a graphic representation of the data presented in a chart. By default, a legend will display either the X-axis value of each data point or the series name, depending on the composition of the chart.
Legends displays information in columns, referred to as Legend Cell Columns. By default, a legend will contain two columns, showing a themed marker and a data value respectively. These columns can be individually modified and further columns showing other information can be added.
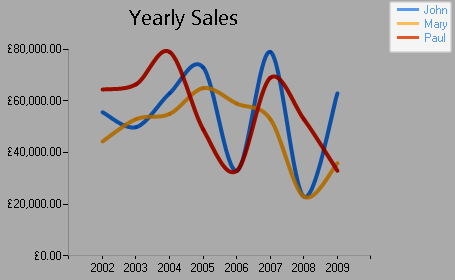
Spline chart with a legend.
Legends are created and maintained independently of chart areas and must be associated with a series in order to appear alongside a chart. If more than one series in a chart area is associated with the same legend, the legend will display data from each series collectively. When multiple series reference different legends, each legend will render separately within the chart area.
To view and manage legends in a chart definition, open the Legends panel within the Chart Definition interface.
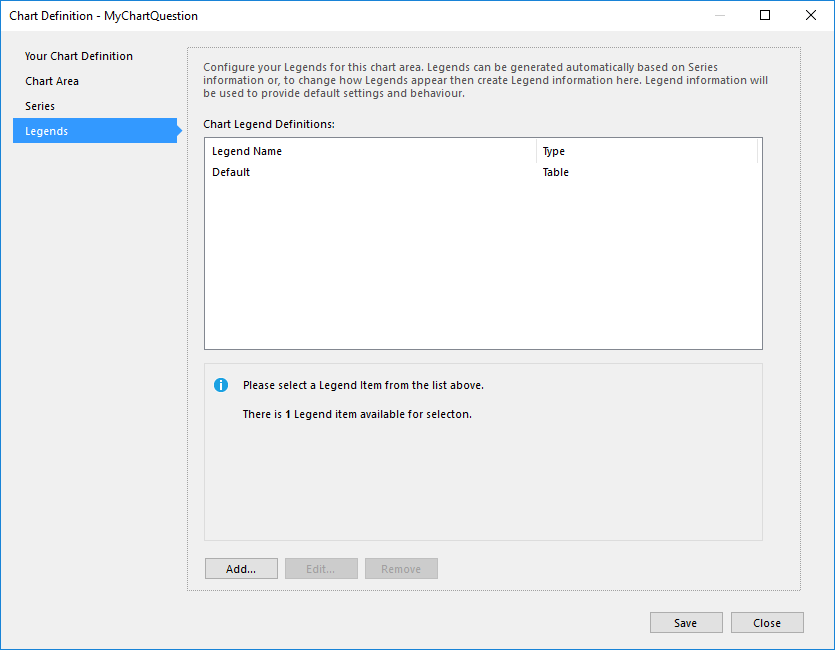
Managing legends in a chart definition.
Every chart definition will include a single legend named "Default", which is added when the definition is created.
From here you can Add and Edit legends, which is done using the Chart Legend interface.
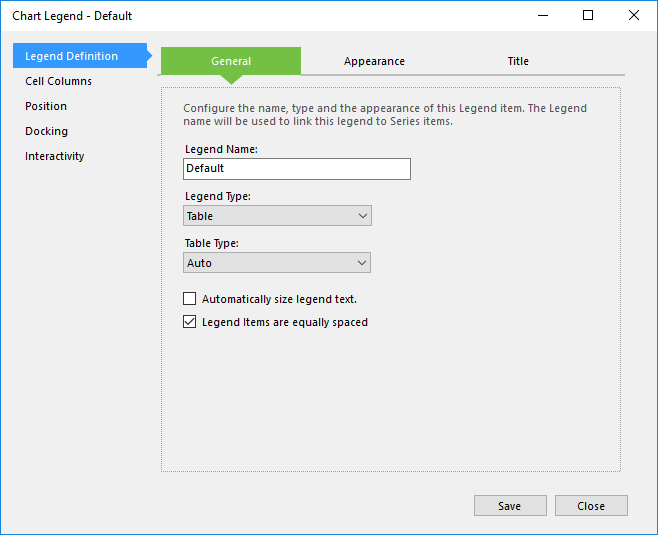
Configuring a chart legend.
To learn how to configure and modify chart legends, refer to the following topics:
| Description | Further Reading |
|---|---|
| Add a new legend to a chart definition. | Creating a Chart Legend |
| Edit an existing legend. | Editing a Chart Legend |
| Permanently delete a legend. | Deleting a Chart Legend |