
Chart legends are constructed using Cell Columns, which contain a single descriptive value each, such as a colour or data item. By default, a legend will contain two columns: one containing symbols that represent either a series or data point, and another displaying a corresponding value.
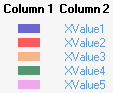
The two default legend cell columns.
Columns can be added to display additional values. These columns will be populated with as many rows as there are series in the chart or data points in the series, depending on how the chart is structured.
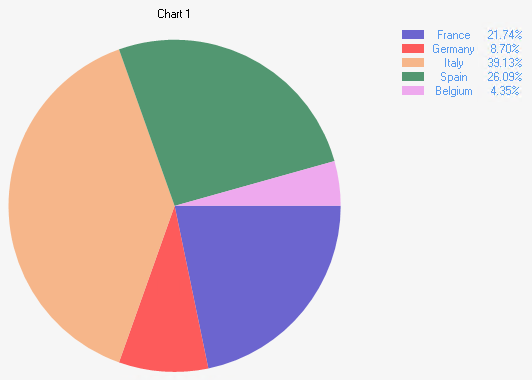
A pie chart with a legend containing three cell columns, the last of which shows the value of each corresponding data point.
Making any changes to a legend cell column will remove all default columns altogether. As such, to use the default columns, you will need to manually recreate them.
Cell columns can be viewed and configured from the Cell Columns panel when managing a legend.
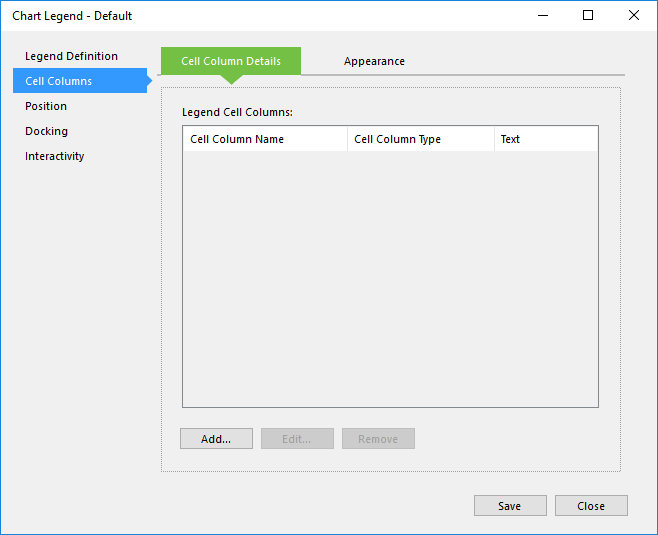
Managing a legend's cell columns.
Cell columns are configured using the Legend Cell Column interface.
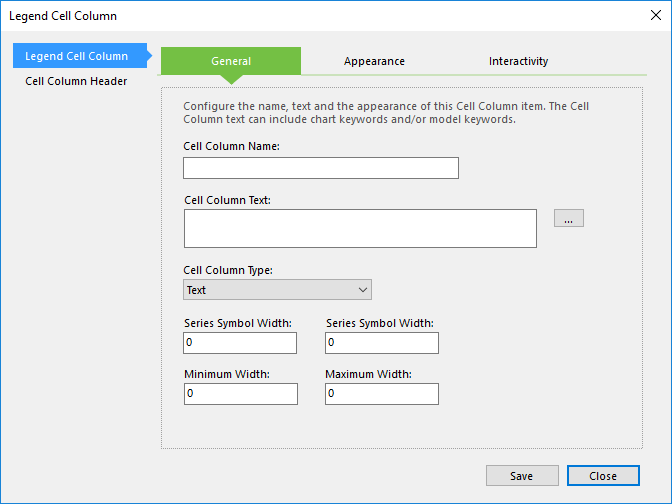
Configuring a cell column.
To learn how to configure and modify chart legends, refer to the following topics:
| Description | Further Reading |
|---|---|
| Add a new cell column to a chart legend. | Creating a Legend Cell Column |
| Edit an existing cell column. | Editing a Legend Cell Column |
| Permanently delete a cell column. | Deleting a Legend Cell Column |