
You can customise the size and position of a chart area within a traditional chart definition. To customise these settings, open the Position panel in the Chart Area interface:
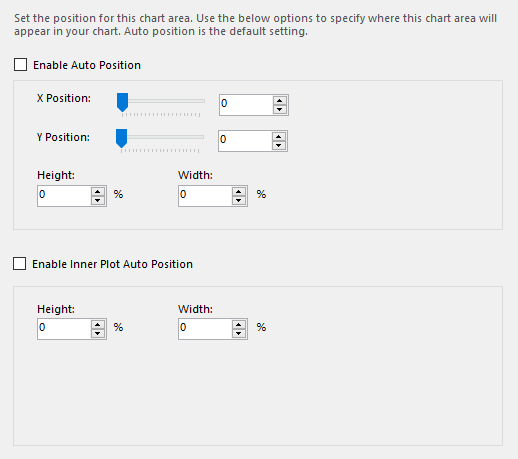
Configuring the position and size of a chart area.
By default, each chart area will have the Enable Auto Position option selected by default, which means that it will fill the full available area.
If all chart areas within a definition have this option enabled, they will automatically be given equal space in the definition.
Unticking this option will enable several other options that you can use to define the area's position and size. These options are as follows:
- X Position / Y Position - These are percentage values that determine where in the definition the chart area will appear. The default value is 0, which will place the area in the top-left corner of the chart definition. For example, changing both options to 50 will place it in the exact middle.
- Height / Width - These are percentage values that determine the relative size of the chart area within the definition. For example, setting this to 50 will make the area take up half of the available definition space.
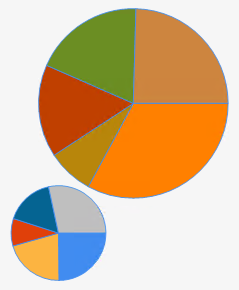
Two chart area within the same definition, both using customised position and size settings.
If any of these options are used, the chart area will ignore the settings of all other areas in the same definition, which can cause them to overlap. The following chart shows an example of this, where the larger area uses auto positioning, so it fills up the entire space of the definition, while the smaller area has been given custom position and size values:
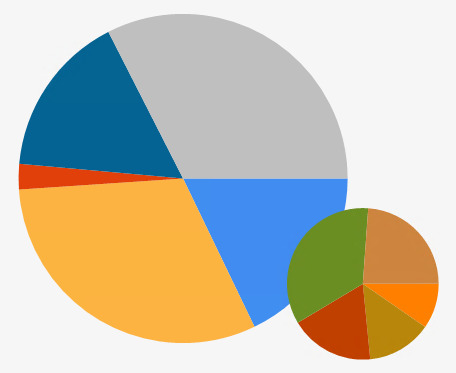
Two chart area with auto positioning enabled and disabled.