
A type of chart that displays six or more values as a rectangle with whisker lines at either end. Additional values can be added by enabling the Box Plot Show Unusual Values option. The Average & Mean and Median values can be hidden using the Box Plot Show Average and Box Plot Show Median options.
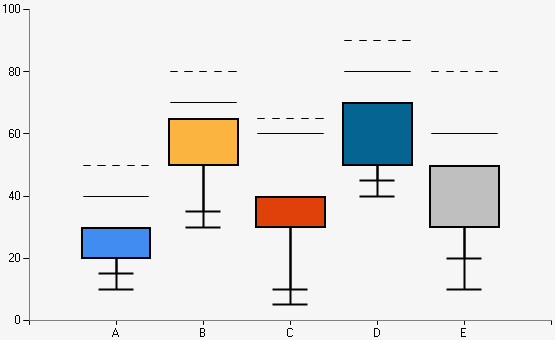
Example of a Box Plot chart.
| Number of Series | 1 or more |
| Y-Axis Values Per Data Point |
6 or more representing: Lower Whisker, Upper Whisker, Lower Box, Upper Box, Average & Mean, Median, [additional values as required] |
| Supports Markers | No |
| Supports Strip Lines | No |
| Incompatible With | Bar, Doughnut, Pie |