
KnowledgeKube Charts let you create graphical representations of structured data. You can use a wide range of chart types to present your data, and power them using both static and dynamic data. Charts are interactive and highly customisable, and can utilise other KnowledgeKube content such as actions and expressions.
The following example shows a Chart Definition containing a single fully configured Pie chart with a Title, a Tooltip, and a colour-coded Legend.
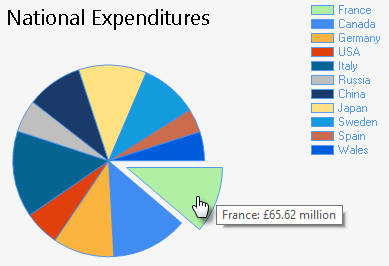
This chart is powered by static data and uses randomly-coloured slices to present data from eleven countries. The legend is generated automatically and matches the colour of each slice to its respective country. Hovering the mouse cursor over a slice will cause a custom tooltip to appear, displaying the value of the slice as a financial figure including an appropriate currency denomination.
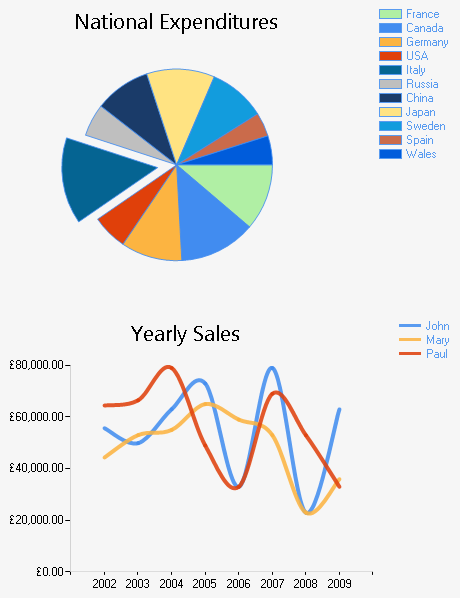
This is only one example of what you can achieve using charts, and all of these elements can be customised as required. A single definition can also contain multiple separate charts of different types, utilising different data sets. The following example shows this, which includes an additional Spline chart that exists in the same definition but is otherwise self-contained with distinct settings and data:
In addition, charts can also be rendered as static images, which can be embedded in documents and emails. They can also include interactive elements, enabling you to run actions and execute expressions when users click on specific elements.
There are two different methods of creating a chart definition in KnowledgeKube:
| Description | Further Reading |
|---|---|
| Universal Charts are driven by data sources and will work on all platforms, including mobile and web applications. They are created using a simplified interface that enables you to see a preview of the final chart during the configuration process. | Universal Charts |
| Traditional Charts can utilise data from several different sources, including expressions, and offer significantly more options for customization. However, they are only compatible with web-based applications. | Traditional Charts |