
A Universal Chart is a type of chart definition that is driven by values from a data source. This type of chart is compatible with all platforms, which means it can be used in both mobile and web-based applications. They are created and managed using a special interface, which includes a visual preview of how the final chart will appear.
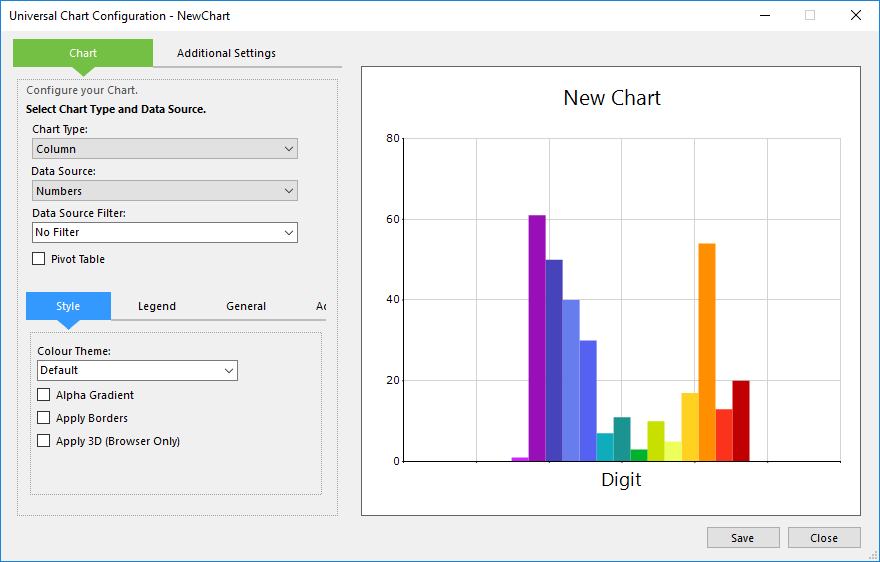
Here you can choose the data source used to generate the chart, which can optionally have a filter applied. You can also make changes to its visual appearance, legend, tooltip, and specify an action that will trigger when the end user interacts with the chart.
To learn how to create and manage universal charts, refer to the following topics:
| Description | Further Reading |
|---|---|
| Create and configure a Chart definition using the Universal Chart Configuration interface. | Creating a Universal Chart |
| Modify the setting of an existing universal chart. | Editing a Universal Chart |