
A type of line-based chart that projects upper and lower error boundaries for a given series of data. The chart consists of three Y-axis values but only requires one input, as the other two are generated automatically to represent the upper and lower error boundaries. The chart can either be provided with its own data or reference another series, using a specific Y-axis value from the first chart, and directly projecting the error boundaries alongside it.
Combining the error bar with another chart requires the Error Bar Series option. The series name and relevant Y-axis index value must be specified as a key value pair. For example: "LineSeries:Y".
Either of the upper and lower boundaries can be hidden using the Error Bar Style option.
The error boundary type can be defined using the Error Bar Type option:
- Fixed Value - A constant value offset from the centre value.
- Percentage - A percentage of the centre value. The default is 10.
- Standard Deviation - A standard deviation of the centre value. The default is 1.
- Standard Error - A standard error of the centre value. The default is 1.
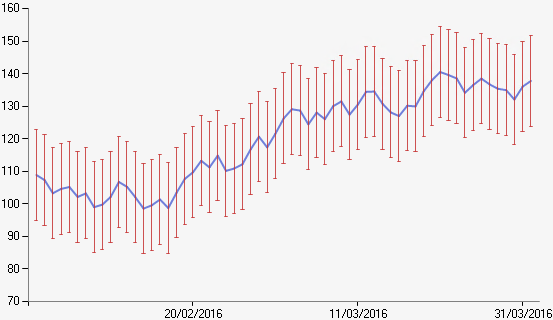
Example of an Error Bar chart.
| Number of Series | 1 |
| Y-Axis Values Per Data Point |
3, representing: Centre/Average Value, Lower Error Value, Upper Error Value |
| Supports Markers | Yes |
| Supports Strip Lines | Yes |
| Incompatible With | Bar, Doughnut, Pie, Pyramid |