
A type of line-based chart that uses different colours to show trends in data. Upward changes are highlighted in one colour, while downward changes are highlighted in another.
The chart is structured according to a formula, meaning trends only change direction when a specific reversal limit—typically 4%—is reached. As a result, a different number of data points may appear in the chart than in the source data, and the chart does not strictly follow the passage of time.
The Series Colour is applied to the down-trending parts of the chart, and a darker version of the series colour is applied to the up-trending parts. The up-trending colour can be manually defined using the Price Up Colour option.
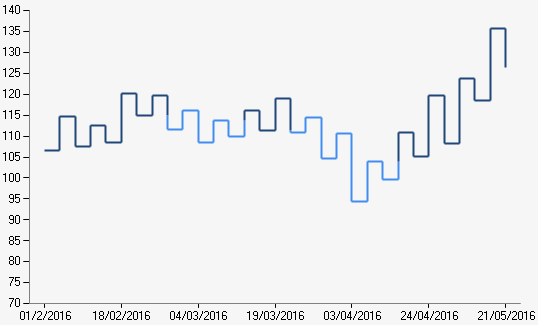
Example of a Kagi chart.
| Number of Series | 1 |
| Y-Axis Values Per Data Point |
1 |
| Supports Markers | Yes |
| Supports Strip Lines | Yes |
| Incompatible With | All other chart types |