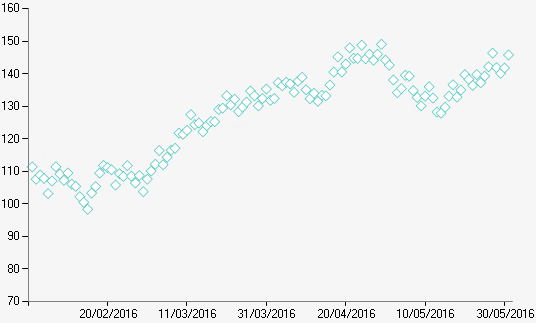
A type of chart that represents data as single, unlinked points. The size and style of the points are defined using the Marker options in the Series Definition. The points are square by default.
The Fast Point chart type is a version of Point charts that is optimised for large data sets.

Example of a Point chart.
| Number of Series | 1 or more |
| Y-Axis Values Per Data Point |
1 |
| Supports Markers | Yes |
| Supports Strip Lines | Yes |
| Incompatible With | Bar, Doughnut, Funnel, Pie, Polar, Pyramid, Radar, Stacked Bar |
