
A type of chart that plots two Y-axis values as the bottom and top value of a Column.
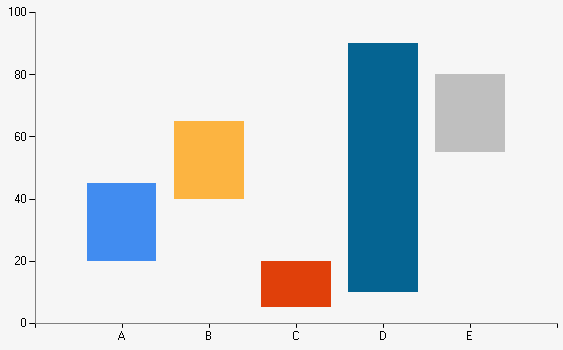
Example of a Range Column chart.
| Number of Series | 1 or more |
| Y-Axis Values Per Data Point |
2, representing: High Value, Low Value |
| Supports Markers | No |
| Supports Strip Lines | Yes |
| Incompatible With | Bar, Doughnut, Funnel, Pie, Polar, Pyramid, Radar, Stacked Bar |