
A type of chart where each series is rendered as a line containing multiple data points that are joined together to form a curved line. Functionally identical to a Line chart.
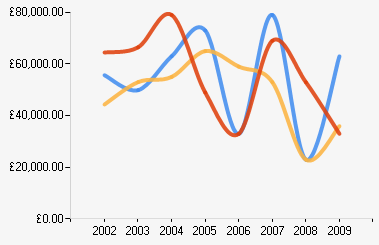
Example of a Spline chart.
| Number of Series | 1 or more |
| Y-Axis Values Per Data Point |
1 |
| Supports Markers | Yes |
| Supports Strip Lines | Yes |
| Incompatible With | Bar, Doughnut, Funnel, Pie, Polar, Pyramid, Radar, Stacked Bar |