
A type of chart that is functionally identical to a Stacked Area chart, except values are rendered as proportions of 100% instead of literally.
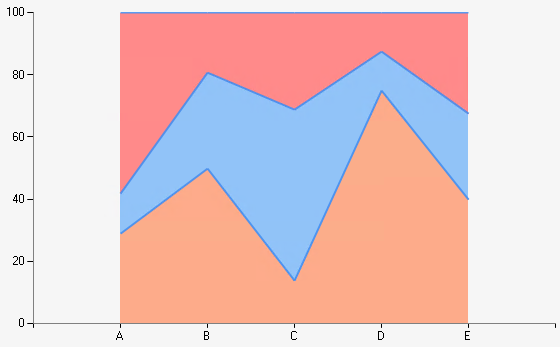
Example of a Stacked Area 100% chart.
| Number of Series | 2 or more |
| Y-Axis Values Per Data Point |
1 |
| Supports Markers | No |
| Supports Strip Lines | No |
| Incompatible With | Bar, Doughnut, Funnel, Pie, Polar, Pyramid, Radar, Stacked Bar |