
The Cross-Table data bind type requires you to pick a single data source field to provide X-axis values, one of more fields to provide Y-axis values, and a Group By Field. Series are generated based on the number of distinct values in the Group By field, with the Y-axis data clustered according to each unique X-axis field in the data set.
The following example shows an example of a spline chart using the Cross-Table data bind, following by a grid representing the values from the chart's source data:
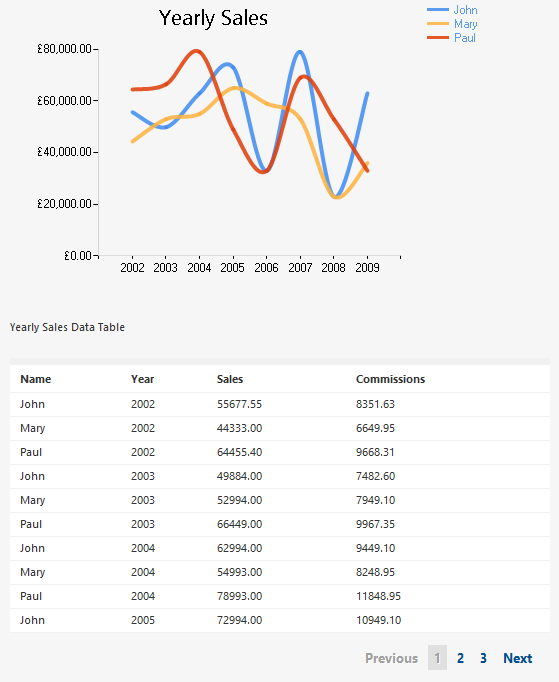
Cross-Table spline chart and source data.
In this example, the Year field is assigned to the chart's X-axis, while Sales is assigned to the Y-axis. The Name field is used to group the data points and since there are three distinct values in the field—"John", "Mary", and "Paul"—the chart generates three corresponding series.
Each of these contains the Sales data associated with the respective name. When the chart is rendered, it generates a line of data points for each series, identified in the chart legend by the grouped data's Name.
The following shows the bind field settings used to produce this chart:
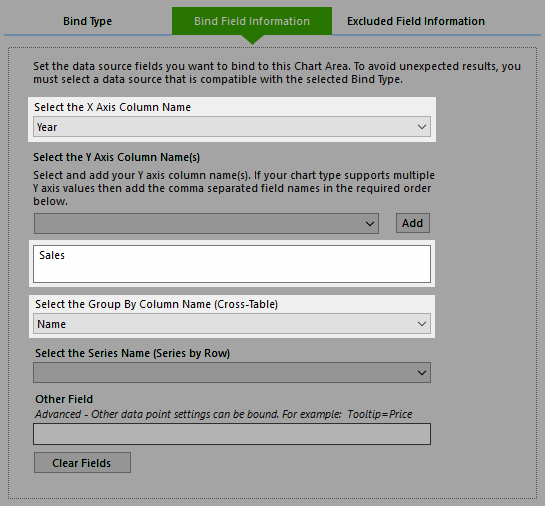
Cross-Table field selections.