
The Series By Row data bind type requires you to nominate one or more data source fields to provide Y-axis values, and another field as the Series Name. The series name field is used in place of X-axis values when determining elements such as the chart legend. For each row in the data source, the chart will generate a series containing the Y-axis values from that row.
The following example shows a column chart built using the Series By Row data bind, following by a grid representing the chart's source data:
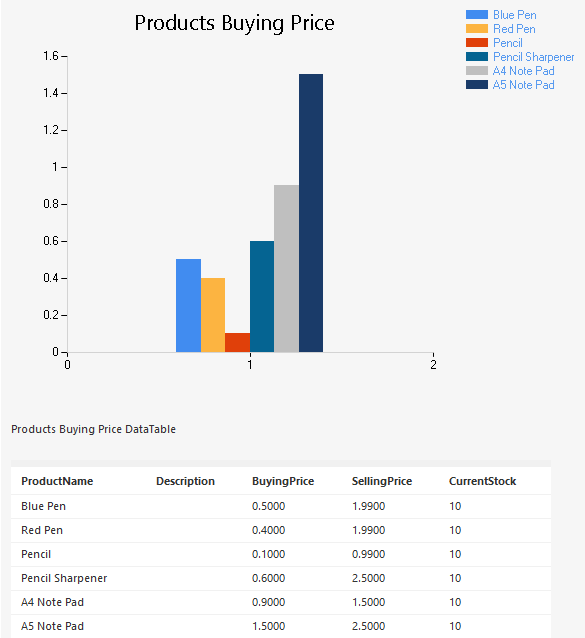
Cross-Table spline chart and source data.
In this example, BuyingPrice is used as the chart area's Y-axis field. Because the data source contains six rows, the chart generates six series, each containing the value of BuyingPrice for the corresponding row.
The chart renders six columns, each one representing the BuyingPrice value in each series. ProductName is used as the series name, so the descriptive values in that field are used to produce the chart's legend.
The following shows the bind field settings used to produce this chart:
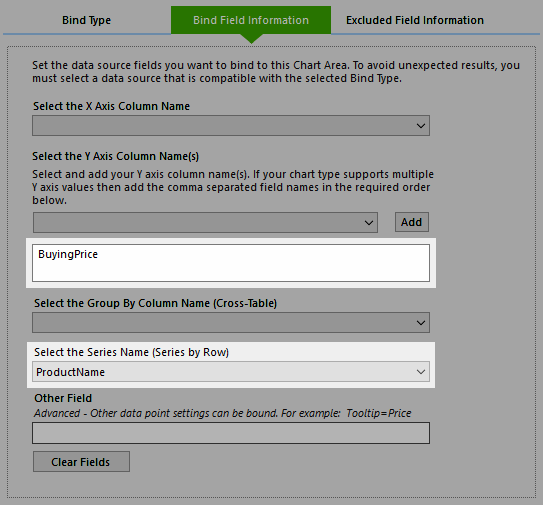
Cross-Table spline chart and source data.