
The Table data bind type requires you to nominate a single field from the data source as the chart's X-axis. The remaining fields will be used to create individual series of Y-axis data, unless they are specified in the Excluded Field Information tab.
The following shows an example of a column chart with a Table data bind, following by a grid representing the chart's source data:
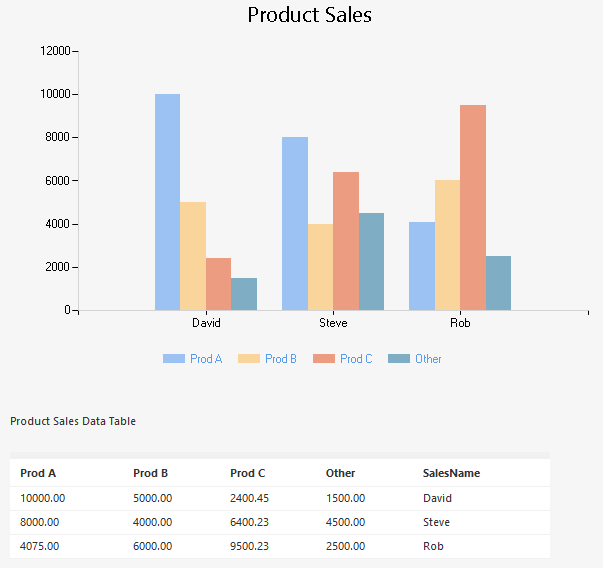
Table chart and data source grid.
In this example, SalesName is used as the chart area's X-axis field. The remaining fields—ProdA, ProdB, ProdC and Other—generate four distinct series, each one containing three data points corresponding with the rows in the table.
The column chart groups data points from the various series by the matching X-axis values, creating a cluster of columns representing the four numeric values in each row of the data source.
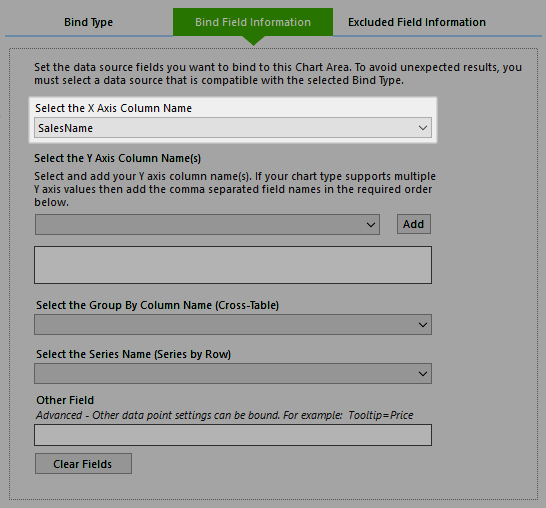
The following shows the bind field settings used to produce this chart:
Cross-Table spline chart and source data.