
The labels, tooltips, and other text associated with a traditional chart definition can be configured to display both static text as well as dynamic keyword values. When a keyword is referenced, the corresponding value will appear in its place when the chart is rendered.
There are two types of keyword that can used in chart text, the first of which is Model Keywords. These are standard KnowledgeKube keywords, such as variables and question keywords. These can be referenced using the following syntax, replacing ModelKeyword with the actual keyword:
~~ModelKeyword~~
The second type are Chart Keywords, which are chart-specific identifiers that correspond to certain chart properties. They are referenced using the following syntax, replacing CHARTKEYWORD with the actual keyword:
#CHARTKEYWORD
Both types of keyword can also be used together, as in this example:
~~UserName~~ has sold #VAL units of #SERIESNAME
An example of this in action is the following chart with a tooltip containing a data point's X- and Y-axis values—a country name and integer value respectively—where the Y-axis value has been formatted as region-appropriate currency:
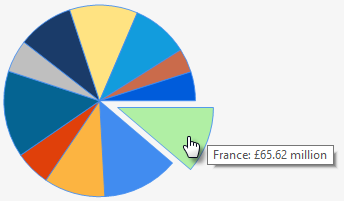
Pie chart with label and tooltip options.
The string used to produce this tooltip is as follows:
#VALX: #VAL{C} million
This tooltip string also uses standard formatting to set the integer as a currency value. A complete list of standard numeric formatting options can be found in this MSDN article.
To use a chart keyword, write it into the relevant text field or use the button marked with a ellipsis (...).
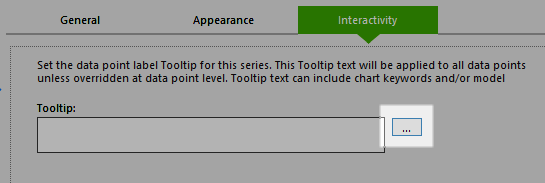
Option for editing tooltip text.
This will open an editor in a new dialog where you can manually select the chart keyword to add. Select the keyword from Available Chart Keywords drop-down menu and click Insert Keyword.
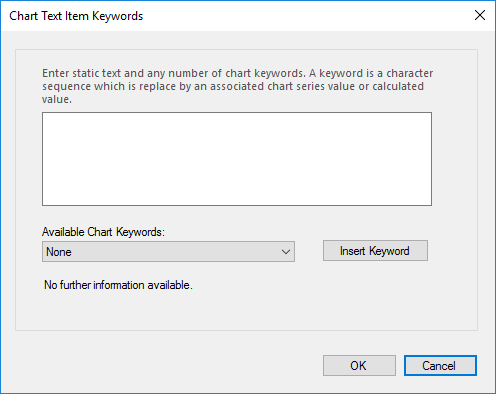
Adding keywords to text in a chart.