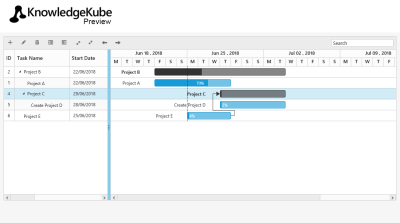
Using KnowledgeKube you can create a Gantt chart, and interact with it in your application.
This type of chart provides a graphical representation of the tasks in your project, and illustrates their relationship to one another and the schedule using a cascading series of horizontal bars.
If the Gantt chart fails to render on the front end, you will need to add a JQuery script to the page or your site's master page. You can download the latest version of JQuery here and then use it to create a script. For more information, refer to Assign Metadata Properties to a Page.
To learn how to configure and modify the Gantt control, refer to the following topics:
| Description | Further Reading |
|---|---|
| Use a special interface to configure the Gantt chart. | Configuring a Gantt Chart |
| Add a Task to the Gantt chart that includes general information and Resource data. | Creating a Gantt Task |
| Modify the details of an existing task. | Editing a Gantt Task |
| Permanently remove a task from the Gantt chart. | Deleting a Gantt Task |

