Create two tables that store Task and Resources information, configure two data sources to store the table data, and use a special interface to configure the Gantt control in your model.
Implementation:
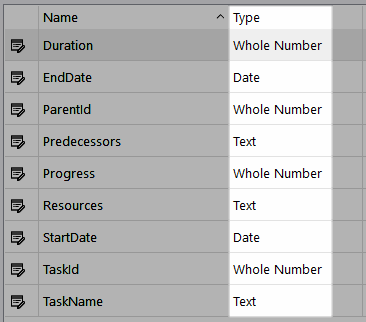
- Create the table structure for the control to store Task data for the Gantt chart . Add the following properties: TaskId, TaskName, StartDate, Resources, Progress, Predecessors, ParentId, EndDate, Duration. For more information refer to Designing Your Own Data.
- Make sure the table properties are assigned the correct Types:

Task table property types.
There must be no data in the table when the properties have been added.
- Create a second table to store Resources data. Add the following properties: ResourceId and ResourceName, and assign the following property types to them:

Resource table property types.
This table holds information on the resources required to complete task. For instance, you could create a list of names in the Resource Name table column, so that when you add a task later you can assign resource to it.
- Create two data sources corresponding with both tables fields to store tasks and resource information you will be adding to the Gantt chart later.
- Add aliases to each table's data source fields.
- Create two actions - use the WriteData function to add a new row of task data or update an existing one.
Creating actions will allow data to be passed between KnowledgeKube and your data source. When a new or existing task is added to the Gantt chart the information will be stored after you close it. When you re-open it, tasks you have previously added and updated in an earlier session will be retained.
- Add another action using the DeleteData function for deleting tasks.
- Switch to the Definition tab.
- Add the Gantt question type to your question group.
- Double-click the question to open the Properties tab.
- Click the Configure button to open the Gantt Definition dialog.
- Use the Task DataSource and Resource DataSource drop-down menus to select the two data sources you created earlier to store task based information, and resources available for the associated task.
- Use the check boxes next to each day of the week to customise the days you want to include in the working week.
- Use the First Day of the Week drop-down menu to nominate what day you want the chart's week to start.
- (Optional) Tick the Highlight Weekends check box if you want to apply highlighting to the chart.
- Enter the action names you created earlier into the respective Insert, Update and Delete Action drop-down menus.
- Switch to the Data Binding panel.
- To store task and resources data, map the fields of the two data sources you created earlier to the corresponding chart fields in this window.
- Switch to the Time and Date panel.
- Use the options in this window to customise your chart's default view, date format, dates which tasks will be stored between, and other settings.
- (Optional) Switch to the Web panel and configure additional settings specific for when you view the chart via the web.
- Click Save to store the chart's configuration settings. These changes will take effect when you view the Gantt chart in your chosen web browser.
- Access the Gantt chart through the front end to create a new task.
