
Sunburst is a type of chart used to display hierarchical data stored in your KnowledgeKube application. The chart appears as concentric circles, with the centre representing the top of the hierarchy and each level representing a column in a data table.
This chart can be used to visualise the hierarchical relationship and relative values of different data points. The sections of the Sunburst chart are called Segments.
For example, the following chart displays the number of employees based in different locations:
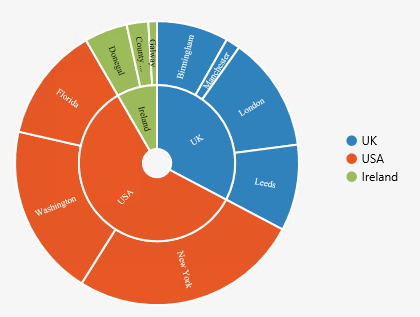
The data used to build the above Sunburst chart would look like this in a table:
| Country | City | EmployeesCount |
|---|---|---|
| UK | Birmingham | 250 |
| UK | Manchester | 50 |
| UK | London | 400 |
| UK | Leeds | 300 |
| USA | New York | 800 |
| USA | Washington | 600 |
| USA | Florida | 400 |
| Ireland | Donegal | 150 |
| Ireland | County Cork | 75 |
| Ireland | Galway | 30 |
Situated to the right-hand side of chart, is the chart's Legend. This represents a visual key that helps the end user to identify the data presented in a chart, based on name, colour, value or other suitable characteristics.
Create your own table with data you want to use, configure a data source, and connect it to the Sunburst chart. Once your data source has been created, use the Sunburst chart's special interface to configure its settings.
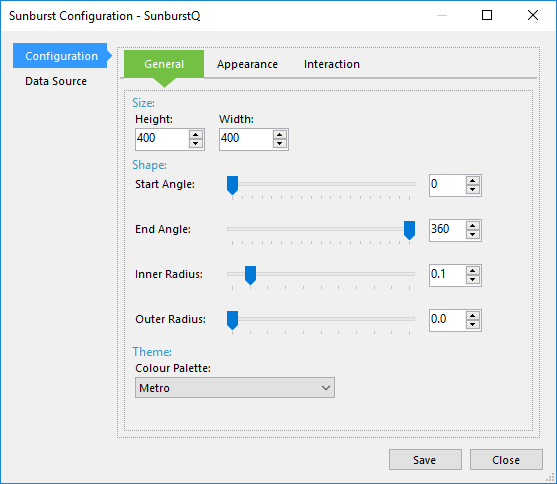
Sunburst's Configuration window.
When your chart's configured using this special interface, your table of data will be displayed just like it is above.
If the Sunburst chart fails to render on the front end, you will need to add a JQuery script to the page or your site's master page. You can download the latest version of JQuery here and then use it to create a script. For more information, refer to Assign Metadata Properties to a Page.
You can get values from a configured Sunburst chart by using the SunburstGetValue function.
To learn how to configure and modify the sunburst chart, refer to the following topics:
| Description | Further Reading |
|---|---|
| Use a special interface to build the Sunburst chart. | Configuring the Sunburst Chart |
| Customise the chart's view when it's displayed in a web browser. | Customising the Sunburst View |