
While a chart legend will always display data from the series to which it's associated, it can be docked and positioned alongside any chart area. The following example shows how the legend associated with Chart 1 docked to Chart 2:
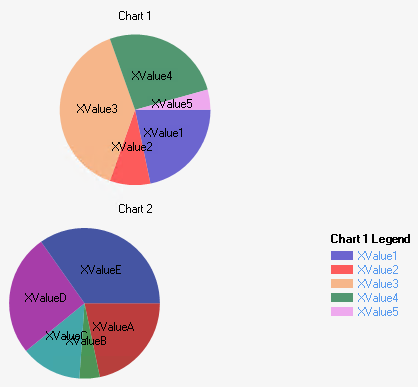
The legend associated with one chart docked to another.
To dock a legend, open the Docking panel within the Chart Legend interface:
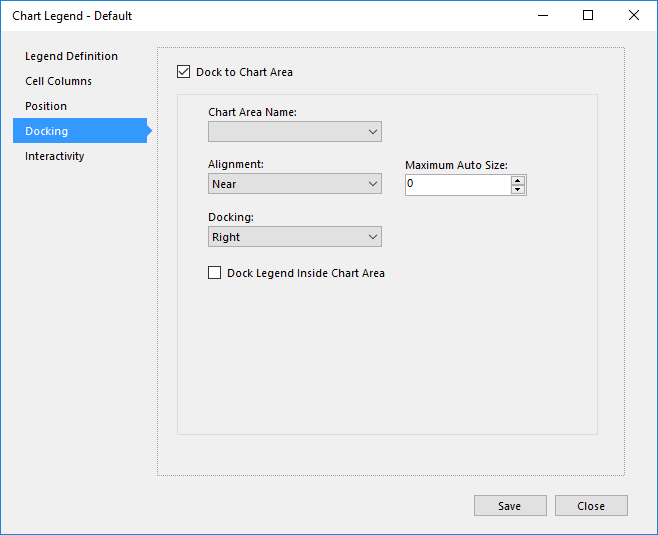
Configuring a legend's docking settings.
This tab contains the following options:
- Dock to Chart Area - Tick this to enable docking.
- Chart Area Name - Select the chart area to dock the legend to.
- Alignment - Determines how the legend should be aligned against the selected chart area. Center positions it in the middle of the chart area, Far places it at the bottom, and Near places it at the top.
- Maximum Auto Size - Determines what proportion of the chart area the legend can occupy as a percentage value.
- Docking - Determines where the legend should be positioned related to the selected chart.
- Dock Legend Inside Chart Area - Tick this to place the legend within the area of the chart axes, according to the alignment and docking options.