
A Series is a sequence of structured data that can be associated with a chart area to render its values. Each series is managed independently of any chart area and must be assigned to one in order to render its data. The series also defines the Chart Type used to present the data.
Series cannot be assigned to more than one chart area, though you can associate multiple series to a single area. If compatible with the chart type, multiple series assigned to the same area will be displayed alongside each other.
Different types of chart also use series in different ways; for example, assigning multiple line chart series to a single area will result in the chart displaying each series as a separate line. However, assigning multiple pie chart series will cause the resulting chart to only show the data from the last series, as this chart type is incompatible with multiple series.
Series can be created dynamically when using certain data bind types. To do this, you may need to create one series and use it as a template to define the default behaviour for the dynamic series to follow.
The following example shows an example of a spline chart containing three series, each represented by a single line of data:
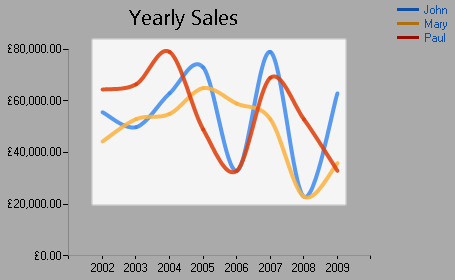
A spline chart containing three series.
A series must also include at least one Data Point. A data point consists of a value for the X-axis and at least one value for the Y-axis. Although data points can be assigned multiple Y-axis values, only certain chart types are capable of rendering more than one Y-axis value per data point.
Data point values are derived from either static or dynamic data, depending on the Data Bind Type of the associated chart area. Static data can be added to the series directly when setting up the chart definition, whereas dynamic data can be added using either the WithChartItems function or a model data source.
To view and manage series in a chart definition, open the Series panel within the Chart Definition interface.
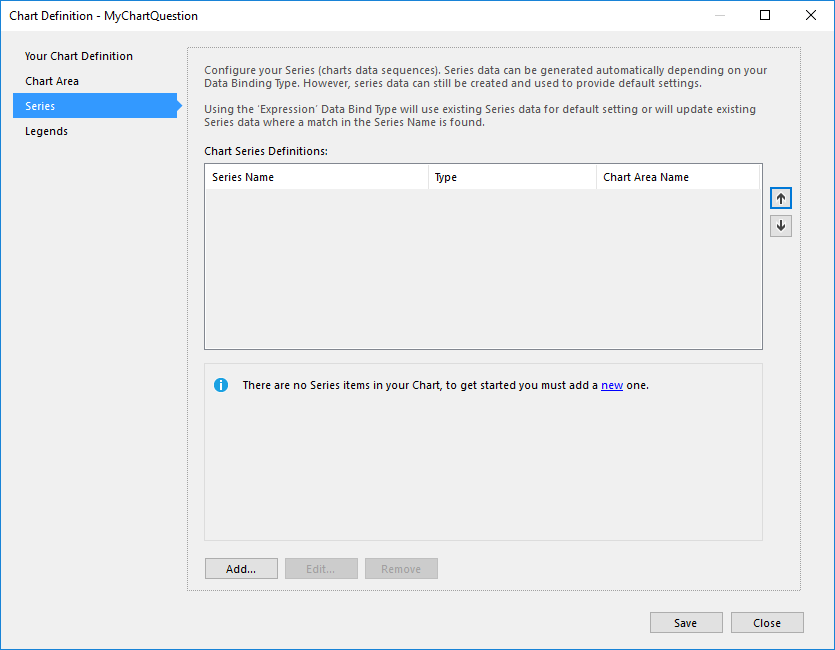
The Series panel.
From here you can Add and Edit series, which is done using the Series Definition interface.
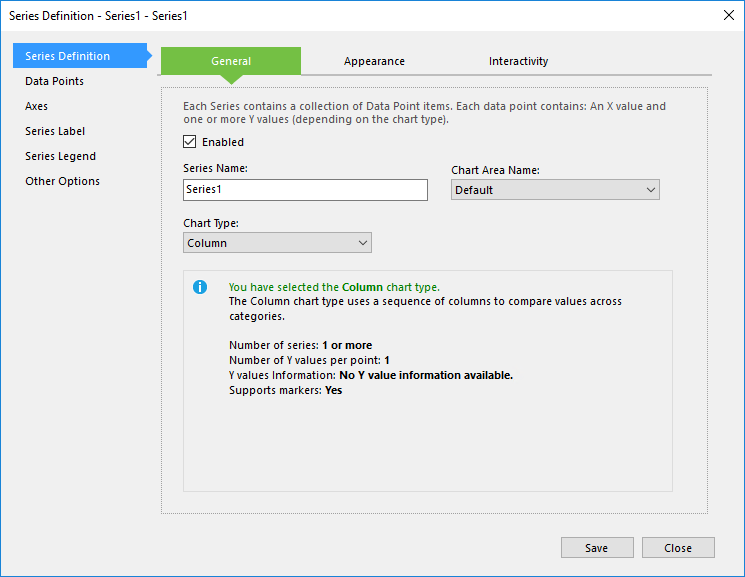
Configuring a series.
To learn how to configure and modify a series, refer to the following topics:
| Description | Further Reading |
|---|---|
| Add a new chart series to a chart definition. | Creating a Chart Series |
| Edit an existing chart series. | Editing a Chart Series |
| Create a copy of an existing chart series. | Copying a Chart Series |
| Permanently delete a chart series. | Deleting a Chart Series |