
A traditional chart definition can be constructed in two ways. It can be Static, which means its structure and data is defined during the creation process. This requires you to create every series and data point manually, which is ideal if you intend on the chart displaying unchanging data.
Charts can also be Dynamic. This means that they receive data during an application's runtime, such as from a data source or a series of expressions. The chart definition provides a number of options that enable you to establish a structure for dynamic data to follow.
To define default behaviour, you will need to create at least one appropriately configured series to act as a template. This series does not need to be enabled to be used in this way. It should not contain any data, although an 'empty' data point with no value can be included to provide additional settings for dynamic data points.
Chart areas using dynamic data binds will refer to this template series and data point in order to apply their settings to all dynamically created series and data points added to the area.
The template series can also be re-used by multiple dynamic chart areas of the same type in the same definition.
To define a chart definition's default behaviour, open the General tab in the Chart Definition interface when managing a definition:
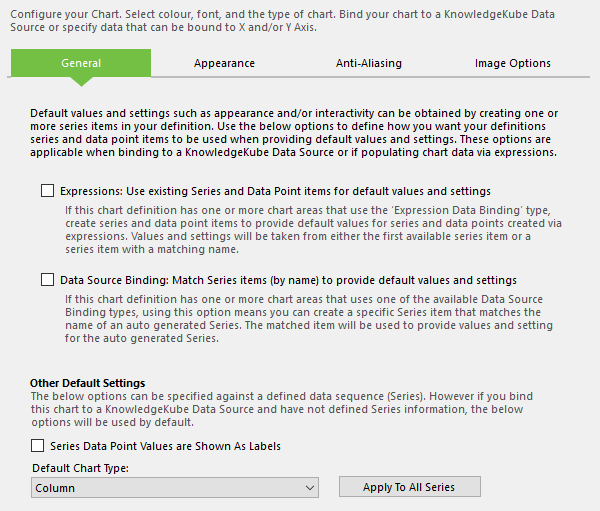
Setting the default behaviour for a chart.
This tab contains the following options:
- Expressions - Tick this if the chart definition includes at least one chart area with the Expression bind type. This will instruct the definition to refer to the first enabled series, or each series whose name matches that of a dynamic series, for all configuration settings.
- Data Source Binding - Tick this if the chart definition includes at least one chart area with the Model Data Source bind type. This will instruct the definition to refer to a series whose name match those of the dynamic series for all configuration settings. Data source driven series are typically named after field names in the source table.
In addition, the following options let you define basic options without creating a template series:
- Series Data Point Values Are Shown As Labels - Tick this to instruct every series in the chart definition to use the X-axis value of each data point as the label for that data point.
- Default Chart Type - Use this to pick a default chart type for every series associated with the definition. Click Apply To All Series to apply the selected chart type.