
A series in a chart must contain at least one Data Point, which is comprised of at least one value each for the Y- and X-axes. Data points can be assigned to a series in one of two ways; Static data points are added directly to the series definition, while Dynamic data points are added using an expression or data source, depending on the chart's bind type.
When using a dynamic bind type, a static data point may be needed to act as a template for subsequently added data points.. For more information, refer to Appendix: Defining Default Behaviour for Dynamic Charts.
The composition of a series' data points will be dictated by the chart type used. Certain charts—such a pie charts—do not require X-axis values. However, other types of charts—for example box plots—can render multiple values on the Y-axis.
The following example shows a line chart with a single series that contains five data points, which have been given labels for clarity:
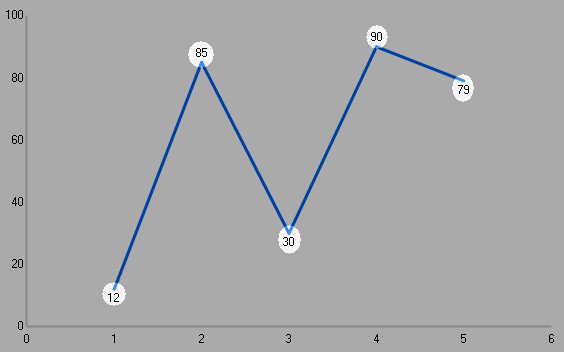
A line chart with five data points.
To view and manage data points within a series, open the Data Points panel within the Series Definition interface, which is used to configure chart series.
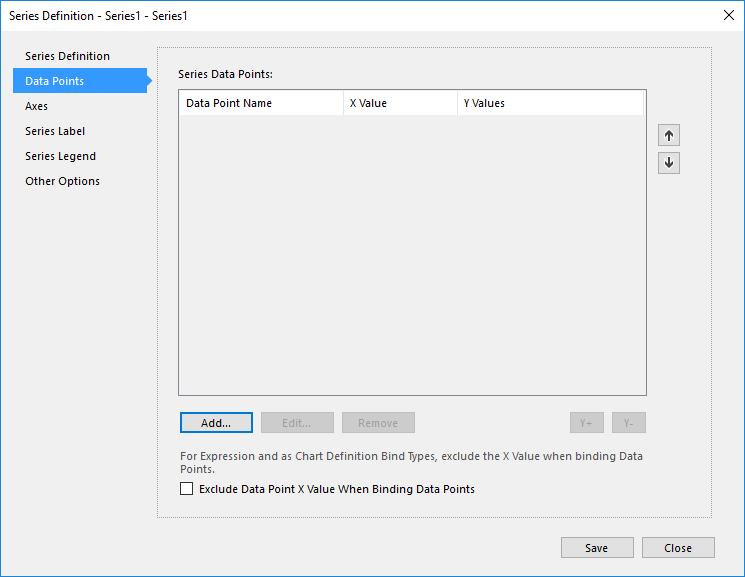
Managing data points in a series.
From here you can Add and Edit data points, which is done using the Series Data Point interface.
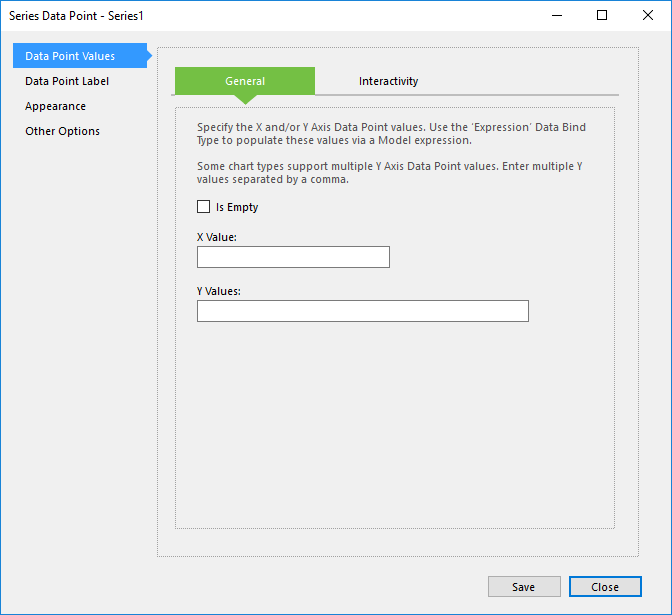
Configuring a data point.
To learn how to configure and modify data points in a series, refer to the following topics:
| Description | Further Reading |
|---|---|
| Add a new data point to a chart series. | Creating a Series Data Point |
| Edit an existing data point. | Editing a Series Data Point |
| Create a copy of an existing data point. | Copying a Series Data Point |
| Permanently delete a data point. | Deleting a Series Data Point |