
A type of chart that represents data as single, unlinked points. The size of each bubble is determined by the second of the two Y-axis values. The appearance of the bubbles is defined using the Marker options in the Series Definition. The bubbles are square by default.
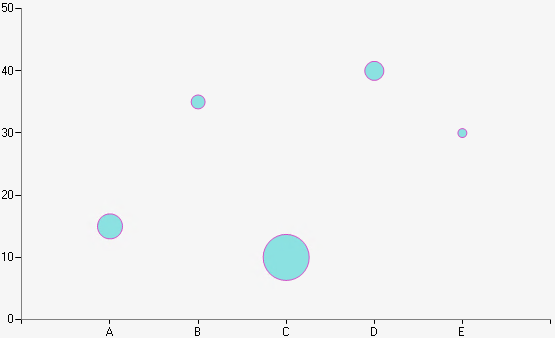
Example of a Bubble chart.
| Number of Series | 1 or more |
| Y-Axis Values Per Data Point |
2, representing: Point Value, Point Size |
| Supports Markers | Yes |
| Supports Strip Lines | Yes |
| Incompatible With | Bar, Doughnut, Funnel, Pie, Polar, Pyramid, Radar, Stacked Bar |