
The Y Values data bind type requires you to nominate a single field from the data source as the chart's Y-axis. This bind type can only be used for charts with a single series, and is best suited for chart types that do not require an X-axis, such as Pie.
The following shows an example of a pie chart with a Y Values data bind, following by a grid representing the chart's source data:
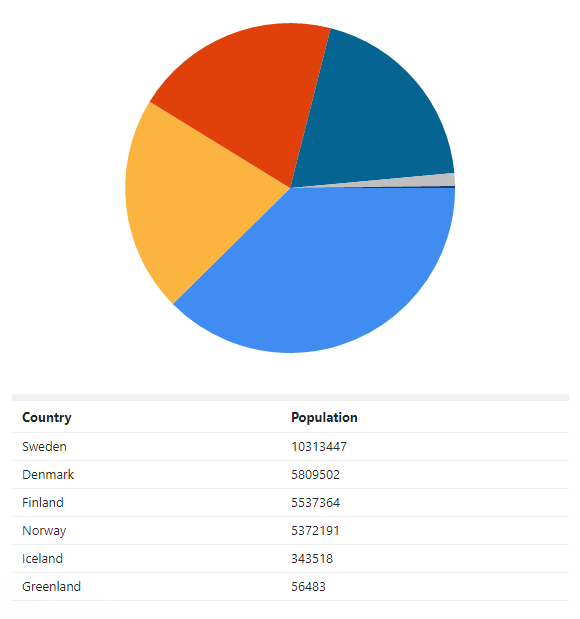
Pie chart and data source grid.
In this example, Population is used as the chart area's Y-axis field, and no X-axis field has been specified. It would be possible to set Country as the chart's X-axis, but it would have no effect on the chart itself. The chart generates one data point for each row, which in this case means creating a slice of the pie representing each country in the list.
The following shows the bind field settings used to produce this chart:
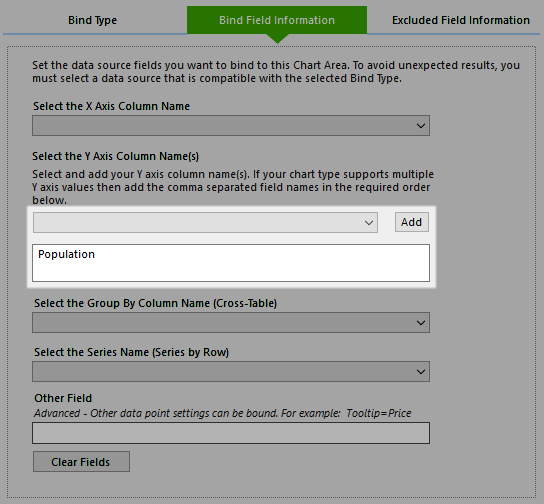
Y Values pie chart and source data.