
Access the Data Designer by selecting the  icon in the Activity Bar.
You don't need to have a model open to access this tool. For quick access to the interface you can press the Ctrl+Shift+Y keys.
This interface consists of several tabs, the first of which is called Summary.
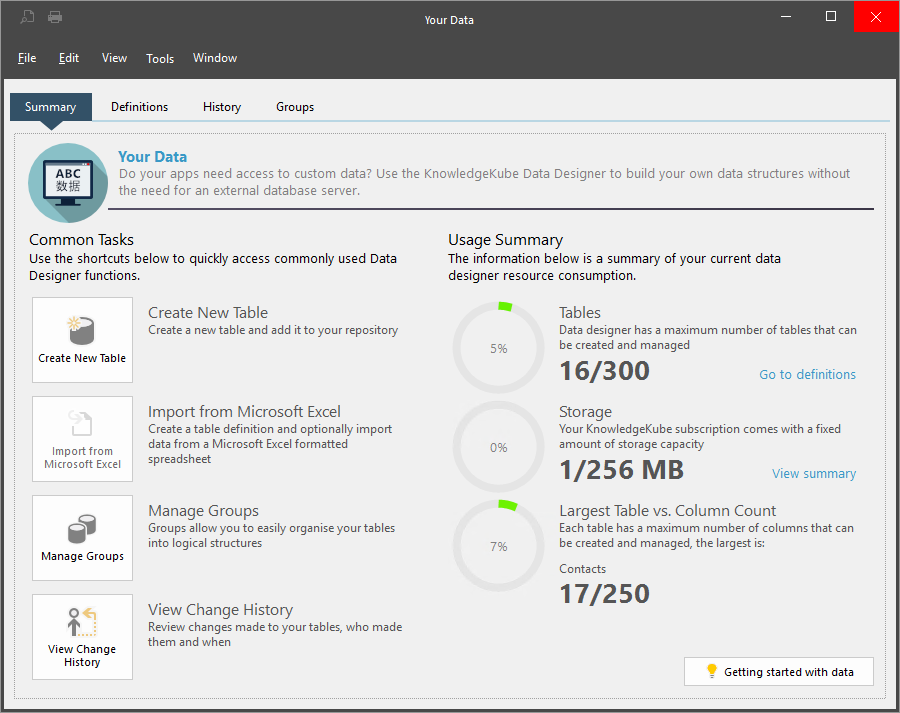
The first window you'll see when you access Data Designer.
This tab contains links to several of the most Common Tasks within the Data Designer. These include:
- Create New Table - Add a new data table to your repository.
- Import from Microsoft Excel - Create a new table by importing a Microsoft Excel spreadsheet.
- Manage Groups - Organise related tables by grouping them together.
- View Change History - Review any changes made to the tables in your repository.
In addition, this tab also provides general information about the Data Designer and your current data. The three graphs in the tab provide the following usage statistics:
- Tables - The number of tables that have been added to the repository.
- Storage - The amount of storage space that has been used.
- Largest Table vs. Column Count - The table with the most columns.
The Data Designer interface also consists of the following tabs:
| Description | Further Reading |
|---|---|
| The Definitions tab lets you view and manage the tables in your database. | Tables |
| The History tab contains a summary of changes made to the tables in the current repository, including which user made them and when. | Viewing Data Designer History |
| The Groups tab contains all groups of data tables. | Data Table Groups |