
The X and Y Values data bind type requires you to nominate a single field from the data source as the chart's X-axis and set one or more fields as its Y-values. This bind type can only be used for charts with a single series, and is best suited for chart types that can accept multiple Y-axis values, such as Box Plot and Candlestick.
The following shows an example of a candlestick chart with a X and Y Values data bind, following by a grid representing the chart's source data:
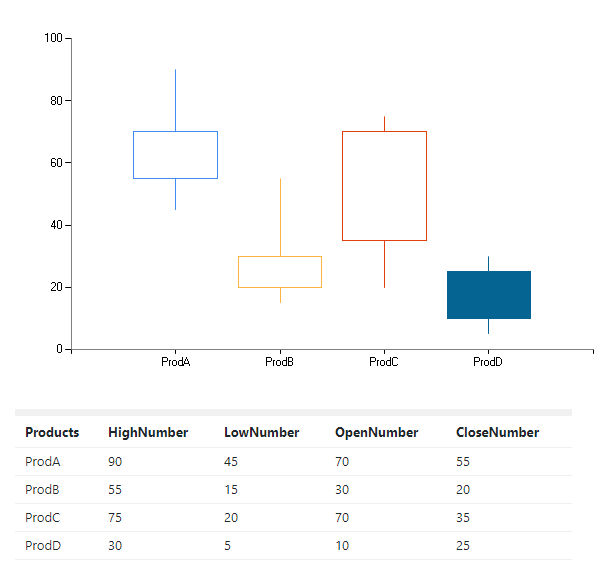
Candlestick chart and data source grid.
In this example, Products is used as the chart area's X-axis field. The remaining fields—HighNumber, LowNumber, OpenNumber and CloseNumber—generate are used as the Y-axis values for the data points.
The column chart generates one data point for each row in the data source. In this case, that means creating four data points, each representing the four numeric values in the specified fields.
The following shows the bind field settings used to produce this chart:
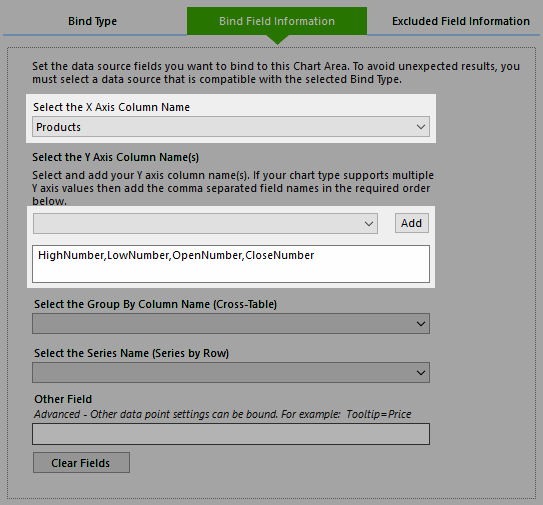
X and Y Values candlestick chart and source data.